Practical Impact Methodology.
Why Impact Metrics?
GIF uses an innovative approach to forecast, track and evaluate results across our investment cycle.
For project selection and appraisal
<p></p> <p dir="ltr">GIF assesses which proposals offer the greatest potential for impact<br /></p> <p></p>
To credibly forecast long-term impact
<p></p> <p dir="ltr">Based on current information, GIF assesses what the long-term impact of our investment will be<br /><br /></p> <p></p>
To track portfolio performance
<p></p> <p dir="ltr">As projects enter, evolve, succeed or fail, GIF assesses the overall anticipated impact of all the investments in our portfolio<br /></p> <p></p>
To balance rigour with practicality
<p></p> <p dir="ltr">GIF seeks to gather the data we need to assess impact in a way which is appropriate given the resources an innovation may have and the size of our investment<br /></p> <p></p>
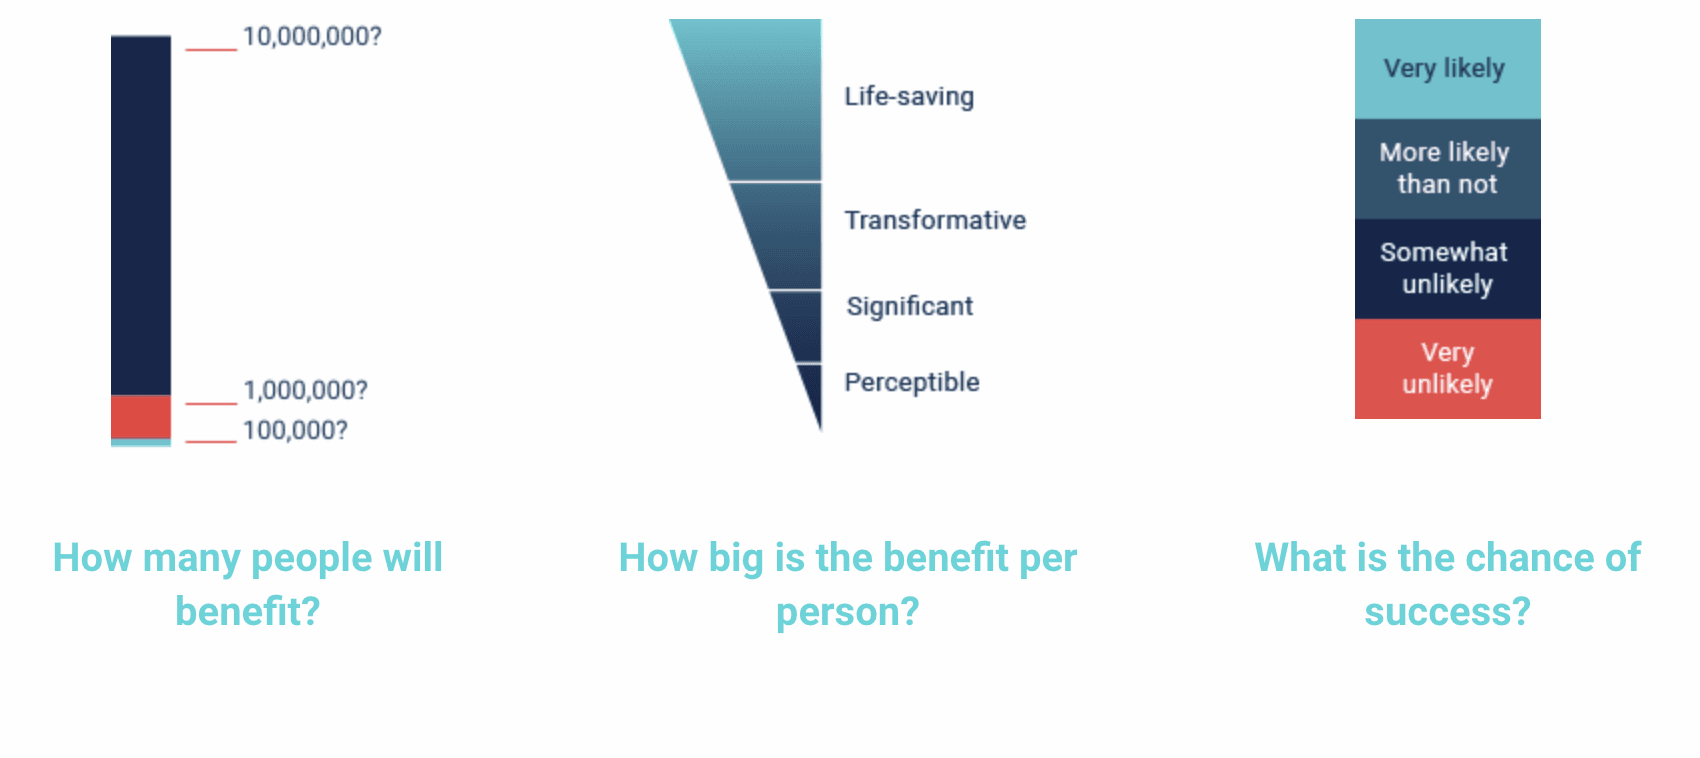
The Measurement Challenge: Comparing disparate outcomes
Problem: ‘people reached’ is an inadequate measure
<ul><li dir="ltr"><p dir="ltr">Some innovations have profound effects on a few people; others have modest impacts on many people.</p></li><li dir="ltr"><p dir="ltr">How do we compare different kinds of impact?</p></li></ul>
Solution:
<ul><li>Measure depth of impact in a way that is comparable across projects</li></ul>
Tracking progress towards long term impact
Problem
<ul><li dir="ltr"><p dir="ltr">It can take 10-30 years to achieve scale.</p></li><li dir="ltr"><p dir="ltr">We need to credibly predict impact long before it is actually observed.</p></li><li dir="ltr"><p dir="ltr">We want to motivate attention to total portfolio impact, knowing that some of our investments will fail, but others could have extraordinary impact.</p></li></ul>
Solution
<ul><li dir="ltr"><p dir="ltr">Risk-adjusted projections, updated as data improves and risks are resolved.</p></li></ul>
THE SOLUTION: Practical Impact defined
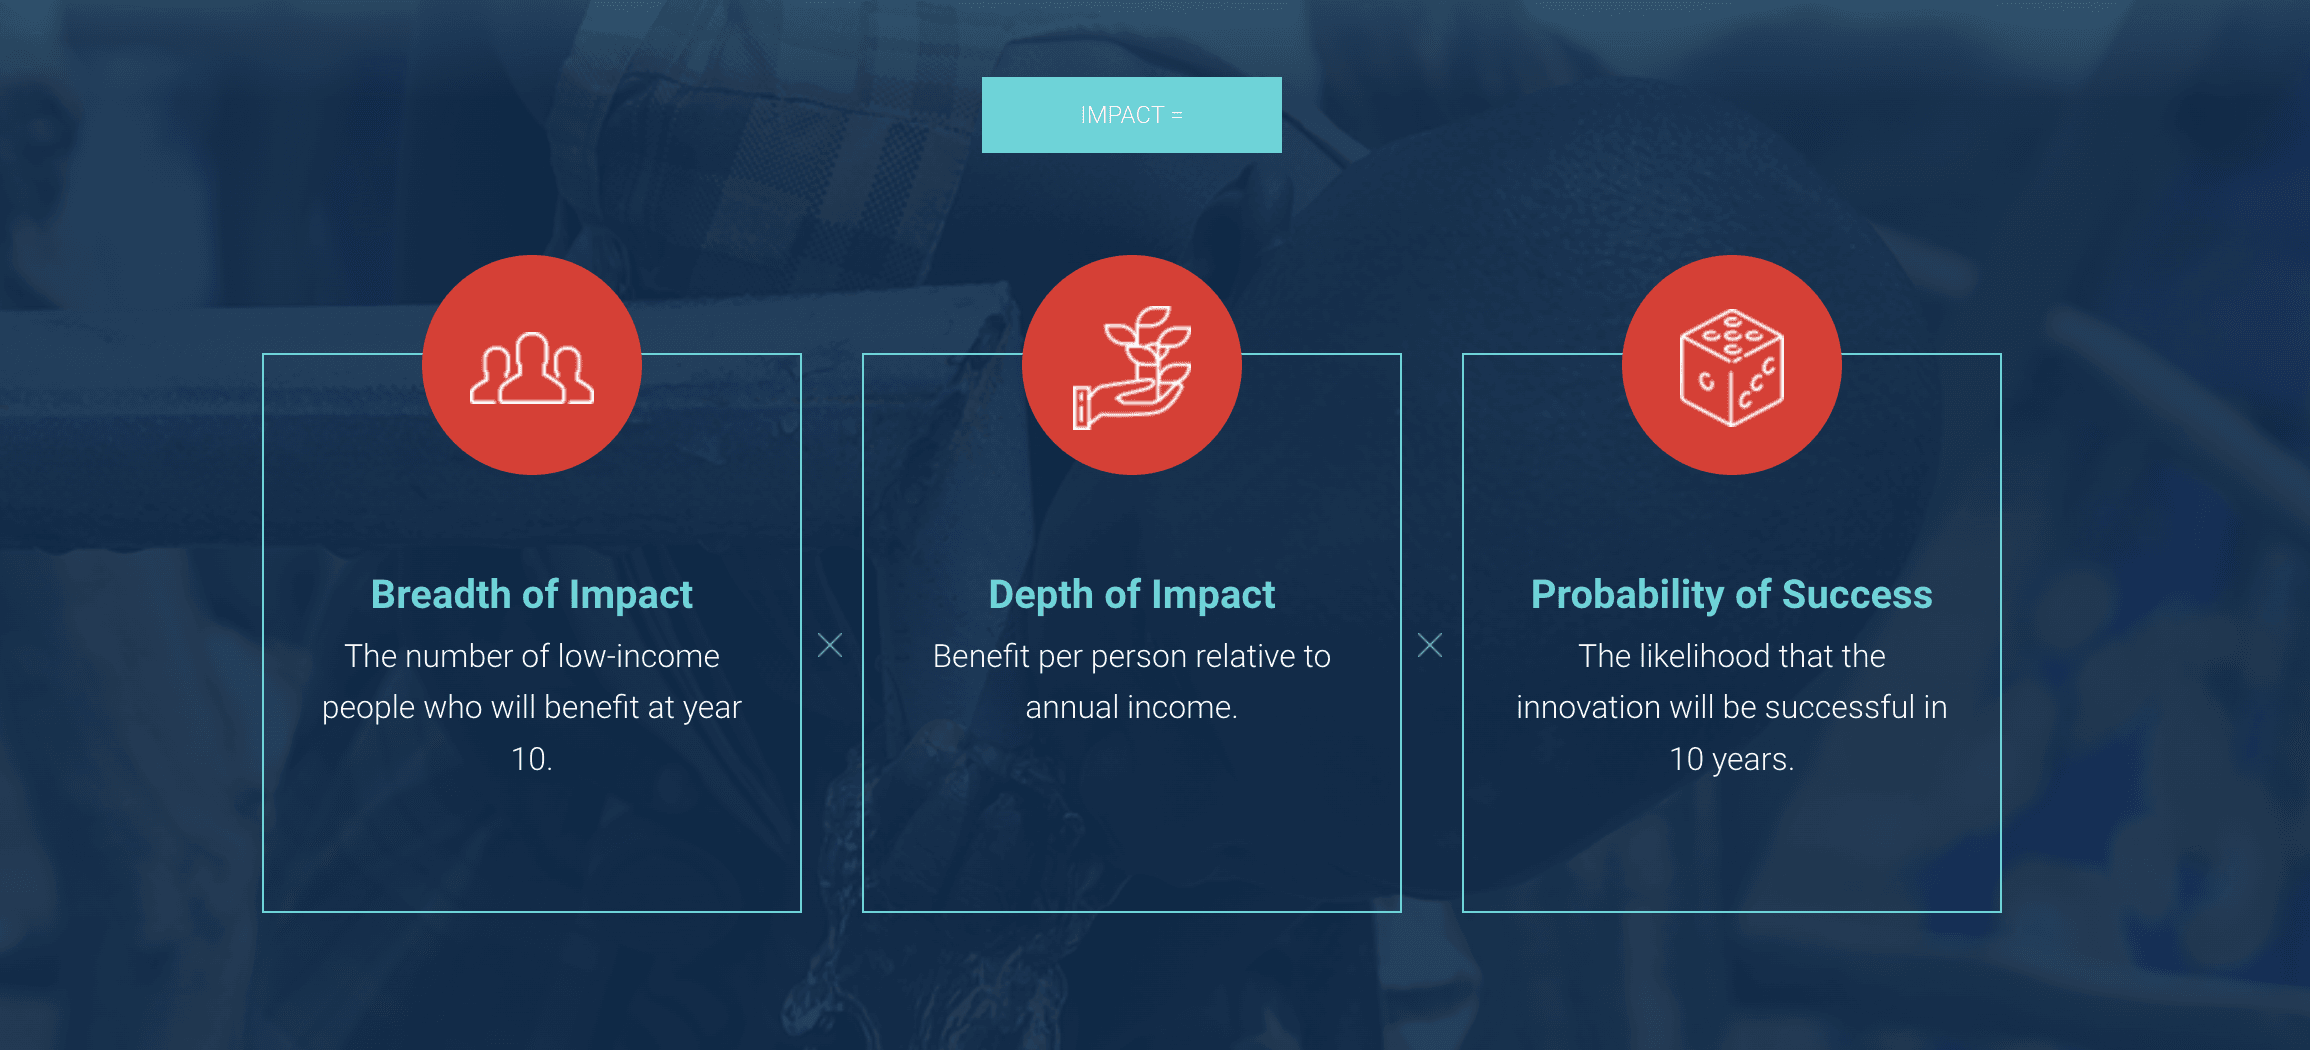
Practical Impact focuses on order of magnitude